
See what your AI coding assistant is actually doing
Preflight captures every tool call, every dollar, and every stall from Claude Code, Cursor, Copilot, and more. Runs on your machine. Sends nothing anywhere by default. Connect New Relic to roll it up across your whole org.
npm install -g @newrelic/preflight && preflight setupRead https://newrelic-experimental.github.io/preflight/start.md and set up Preflight on this machine, then confirm it is capturing this session.Paste into Claude Code, Cursor, or any coding agent.
Ask your agent
Preflight is an MCP server, so the assistant doing the work can answer questions about its own session. Ask in chat and it looks up the numbers.
About 17 minutes in, with 40 tool calls: 20 shell commands, 9 file reads, 6 edits, and 5 searches. 38 of them succeeded, a 95% success rate. You've changed 4 files. Tool calls are averaging 1.6 seconds.
via nr_observe_get_session_stats
$0.015 so far, all on Claude Sonnet 4.6. Almost everything came from cache: 1.45M tokens read from cache against 5K fresh input tokens, which works out to about a cent per million tokens. Output was 25K tokens.
via nr_observe_get_cost_breakdown
The last task scored 0.63 out of 1. Autonomy and first-attempt quality were both perfect and correctness was 0.5, but speed scored 0, which pulled the average down. Across the 11 tasks scored this session, the average is also 0.63.
via nr_observe_get_efficiency_score
Once. I read src/metrics/cost-tracker.ts four times, which usually means the context was compressed and I lost what I had already read. Splitting the task into smaller pieces would avoid that.
via nr_observe_get_anti_patterns
Works with
 Claude Code
 Kiro
Kiro Amazon Q
 Droid
Droid Codex
Codex opencode
 Kilo Code
- Pi
- GitHub Copilot
- GitHub Copilot SDK
- GitHub Copilot app
 Gemini CLI
 Cursor
- Windsurf
 Antigravity
- Zed
- Continue.dev
- Cline
- Generic MCP
15 capture every built-in tool call. 4 see only calls routed to Preflight's own MCP tools.
Visibility
Every file read, edit, command, and search captured as it happens. A live session view plus trends across weeks.
Learn more →Cost control
USD spend per session, day, and week, split by model and cache tier. Budget alerts before you overspend.
Learn more →Efficiency insights
A score per task, detection of re-reads, blind edits, and stuck loops, and weekly coaching from your own history.
Learn more →Dashboards
A local dashboard at localhost:7777 with no account, and 7 prebuilt New Relic dashboards for teams.
Learn more →Watch it live at localhost:7777
Local mode ships with a dashboard that needs no account and never leaves your machine.
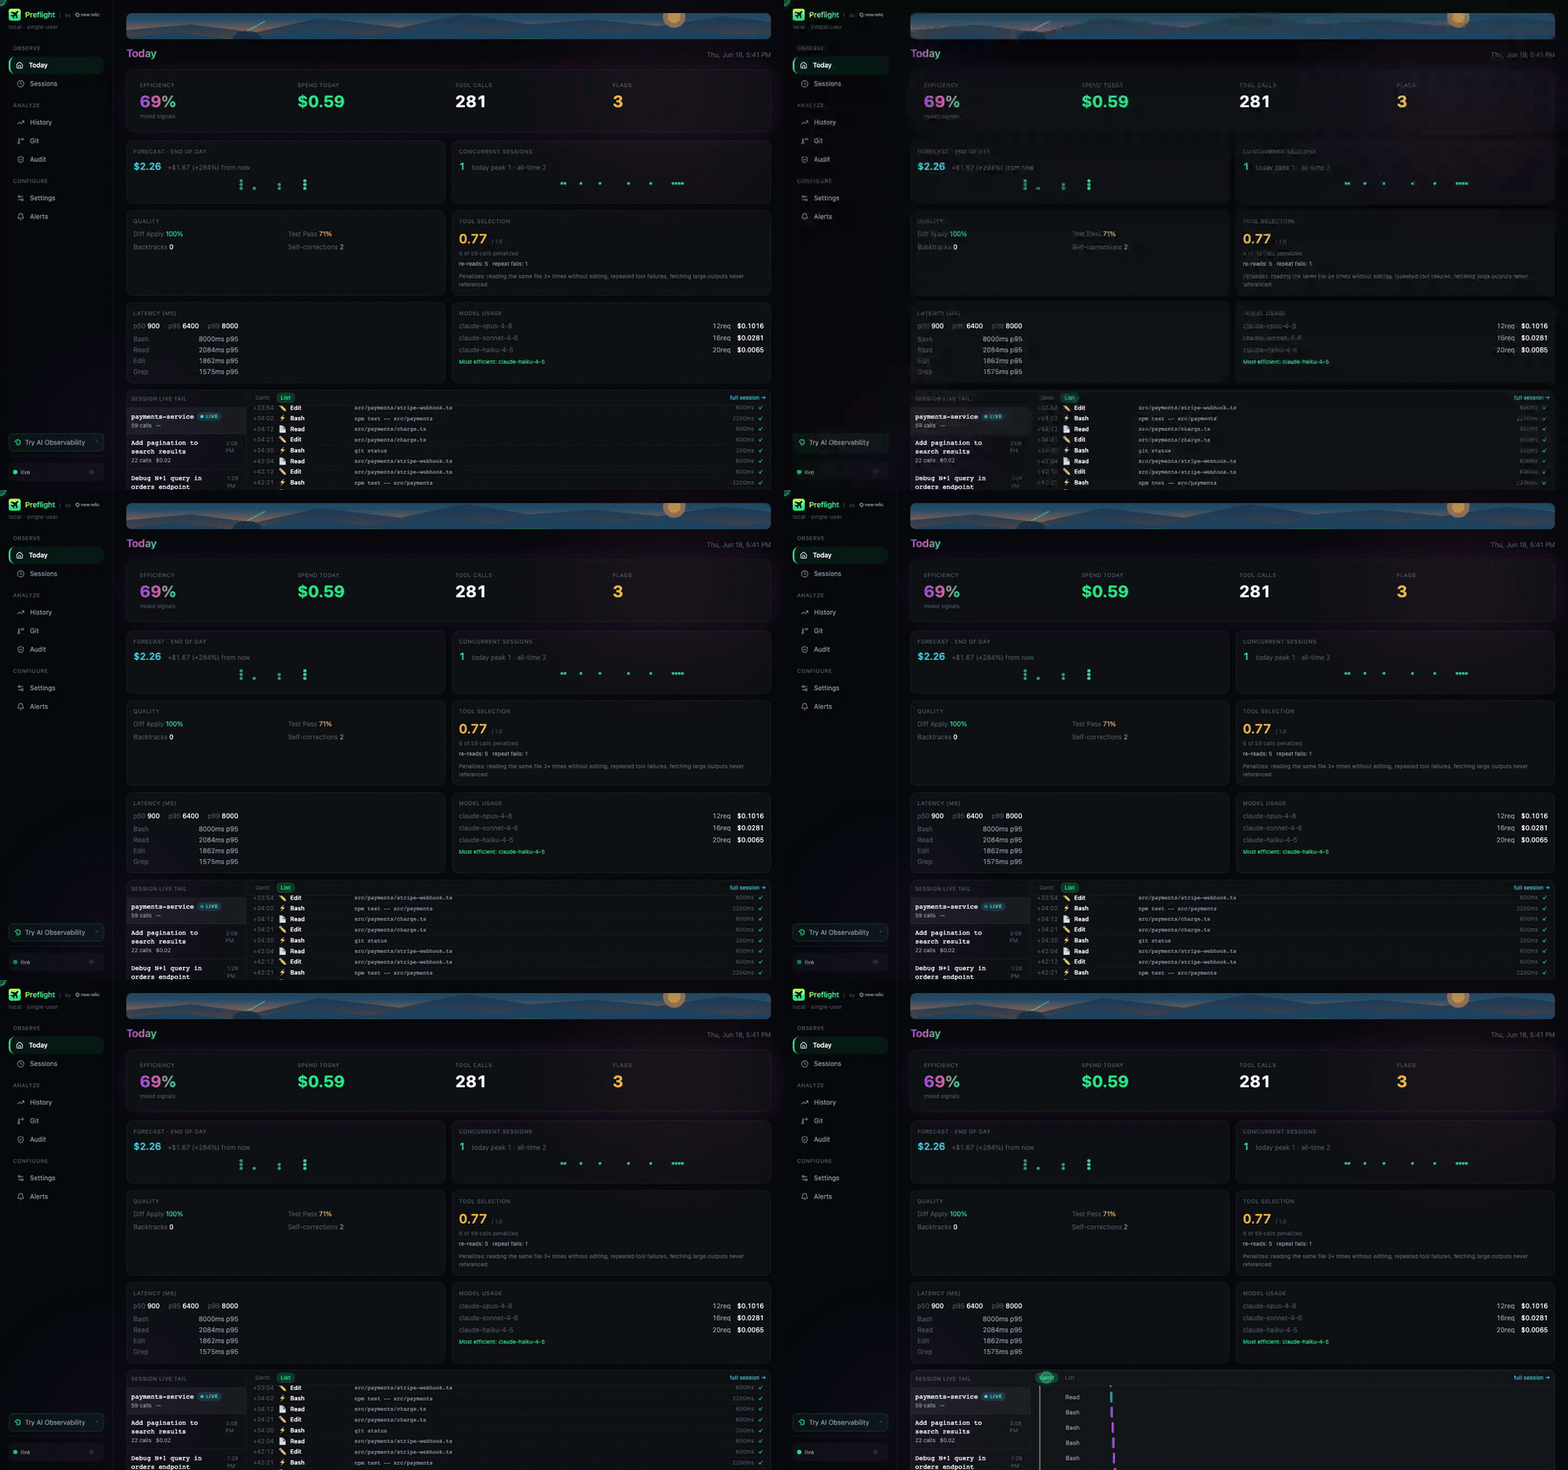
Teams get 8 prebuilt New Relic dashboards.
Measure the return across your org
Connect New Relic and every session from every developer rolls up by team, project, and platform. See what AI-assisted coding costs, what it produces, and where the money goes to waste.
Cost per outcome
Spend split by bug fixes, features, and failed attempts, with a waste ratio and an ROI estimate against hours saved. Commits, pushes, and merged PRs arrive as metrics with the same team attribution as cost.
Efficiency across developers
Efficiency scores, anti-patterns, and retry thrashing compared across the team and tracked week over week, with coaching reports against each developer's own baseline.
Budgets and alerts
Five prebuilt alert conditions: daily cost spike, low efficiency score, stuck-loop rate, anti-pattern rate, and per-session budget. One command deploys the policy.
Platform comparison
Claude Code, Cursor, Copilot, and the rest side by side on cost and efficiency, so a decision about what to standardize on rests on your own numbers.
Manager view carries team metrics with no tool-call content. Security audit tracks sensitive file access and destructive commands.
preflight install --mode cloud --license-key YOUR_LICENSE_KEY --account-id YOUR_ACCOUNT_ID
preflight deploy-dashboards --allUnder a minute to first session
npm install -g @newrelic/preflight && preflight setup